Updated: Deep Dive - 7th Edition of The Chocolate Scorecard | #PSC 201
OVERVIEW: Episode 201 of #PodSaveChocolate features a deep dive – the good, the bad, and the ugly – into the 2026 (7th Edition) of Be Slavery Free’s Chocolate Scorecard.
Links below to watch LIVE and to view the archived episode.

Watch and comment LIVE or view the archived episode!
Subscribe (free!) to the @PodSaveChocolate YouTube channel, like this video, comment, and share this episode to help grow the #PSC community.

Watch and comment LIVE or view the archived episode on LinkedIn.
Join my network on LinkedIn to receive notifications and to refer business to each other.

Watch and comment LIVE or view the archived episode on TheChocolateLife page on Facebook (for 30 days, then watch the archive on YouTube).
Follow TheChocolateLife on Facebook to receive notifications and catch up on other content.
Episode 201 Overview
In this episode: a deep dive into the 7th edition (2026) of the Be Slavery Free (Australia) Chocolate Scorecard.

In my inbox on Wednesday, the 13th from BSF:
Dear Clay,
Every time you choose a chocolate bar, you're casting a vote. The companies that make your chocolate know it too.
We don't guess. We measure.
The Chocolate Scorecard is a rigorous [emphasis added] annual assessment of the chocolate industry. Our questions are developed through consultation with NGOs and subject matter experts, and companies are given the opportunity to review them before the process begins. Responses are independently scored by two experts per topic across a four-stage review process. We publish category scores and aggregate findings, and year on year, the picture becomes clearer.
TL;DR Historical Context
First published in 2020, the Chocolate Scorecard is an attempt by civil society actors to report on the efforts of companies involved in chocolate and cocoa – traders, processors, manufacturers (large and small), and retailers – with respect to several “key sustainability” and “ethical” metrics.
“Mighty Earth, Be Slavery Free, and Green America surveyed the world’s biggest chocolate companies to find out! … This guide breaks down company commitments and policies. It does not assess effectiveness or implementation.”
In this episode, I will focus a critical, skeptical lens on the claims being made in this and prior editions.
Issue: Framing.
- The choice of categories assumes and projects a particular theory of change.
- Question: Does this theory, when implemented in this way, result in meaningful change?
Issue: Lack of Publicly Available Sources
- Many of the companies in the Scorecard publish annual sustainability, sourcing, ESG, and other reports.
- There are NO links to the home pages of any of the companies mentioned.
- There are NO links to annual reports from any of the company websites. (This would be trivial compared with the rest of the research efforts.)
Issue: $$ – there is NO reporting on BSF funding.
- There is a total lack of visibility regarding the cost of producing the Scorecard and the entities and individuals who are footing the bill.
- Do Team members get paid? If so, what?
- What efforts are undertaken to ensure there are no (or no apparent) funding conflicts of interest?
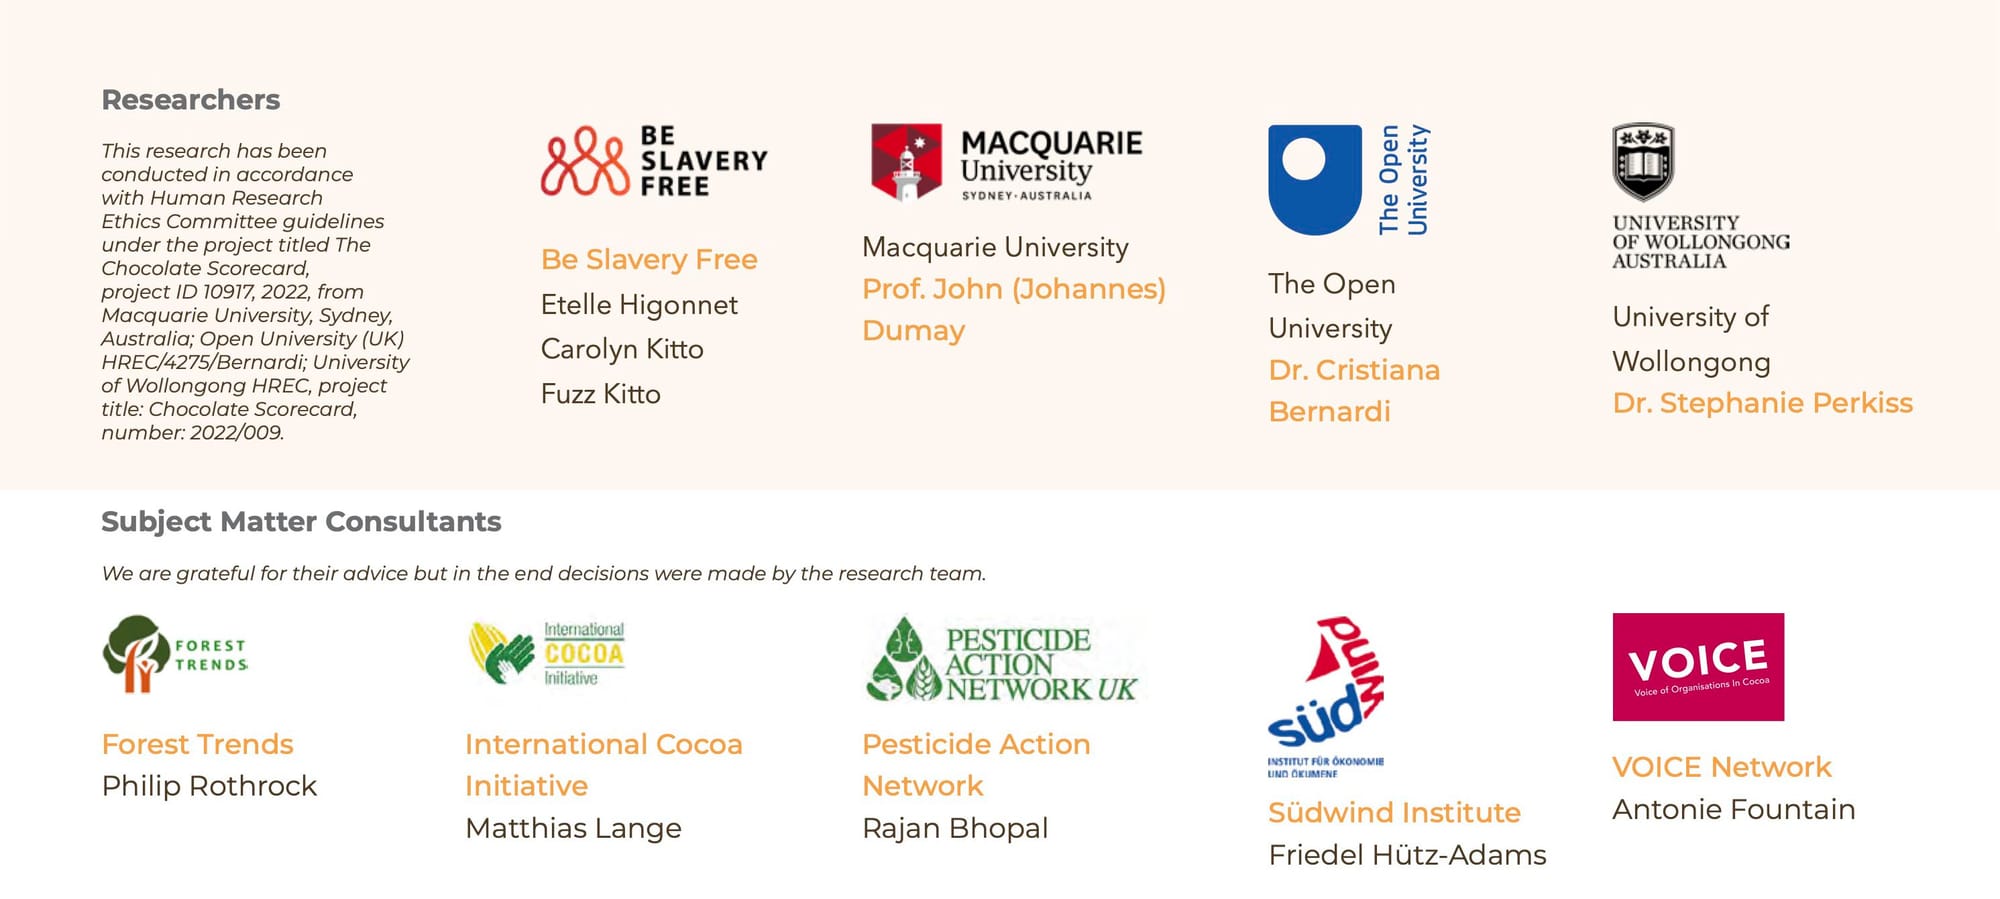
Issue: Why is there so little visibility about the members of the various teams?
- NO current reporting on institutional affiliations. Why not? (Interestingly, this information was published in the 2022 Scorecard.)
Issue: There is NO analysis of impact.
- The 2020 report specifically declares there is no intent to assess the effectiveness or implementation of the policy positions the Scorecard reports on.
- Does the Scorecard motivate changes in consumer behavior?
Issue: Clear lack of traceable history
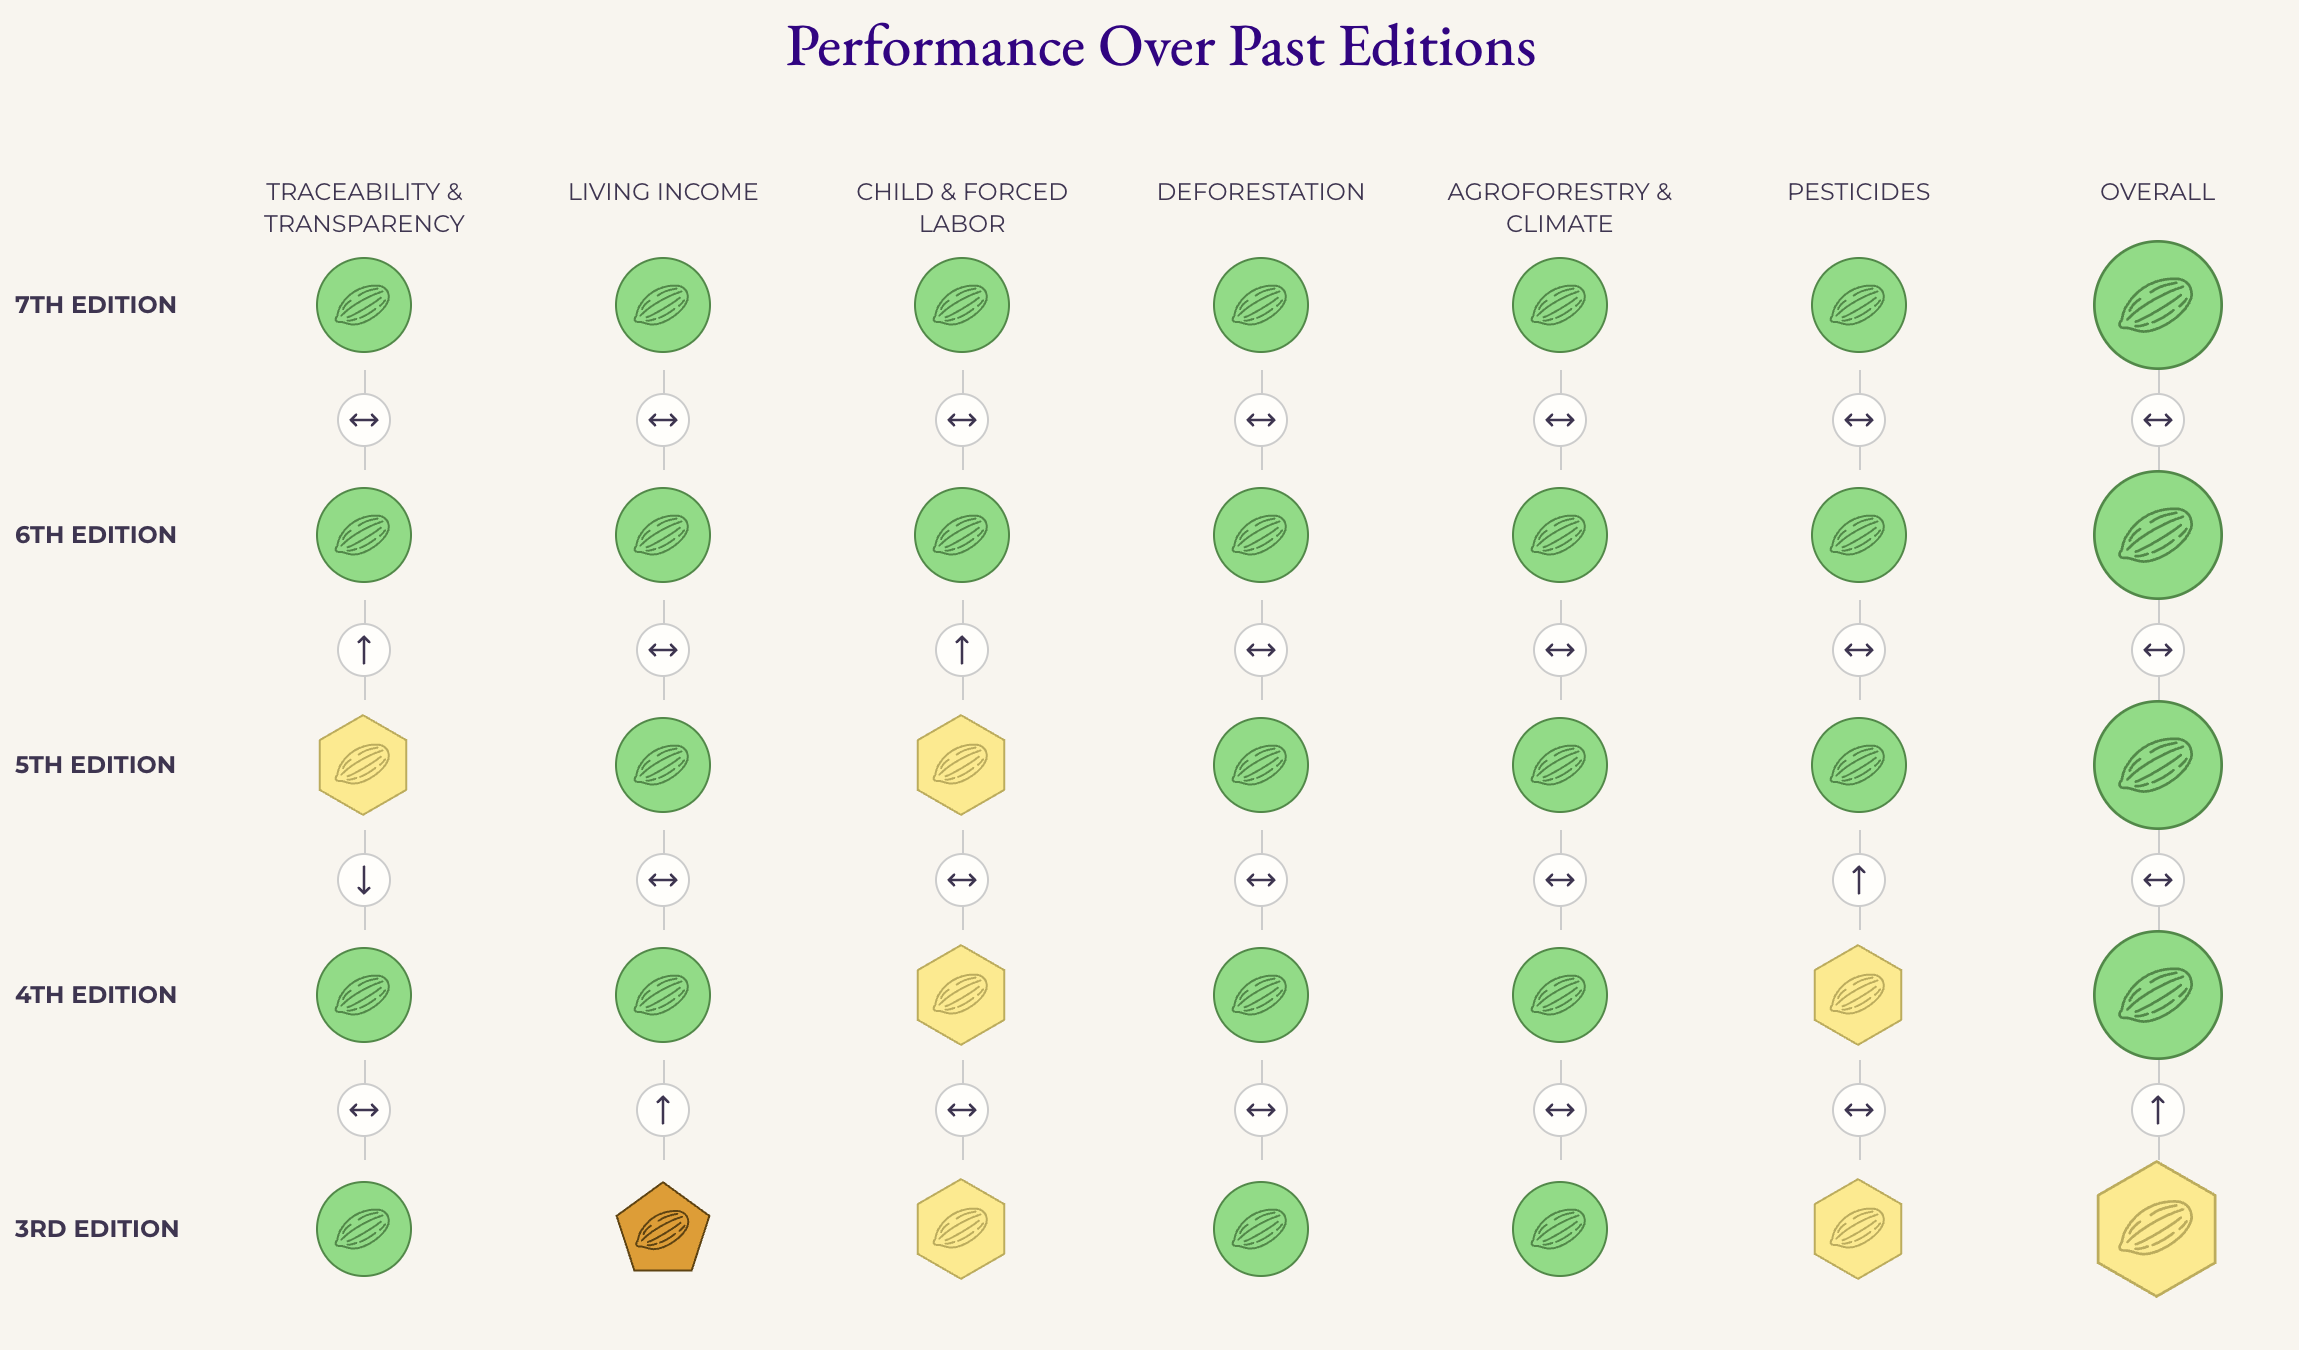
- The Scorecard represents the category structure as being consistent from the 3rd edition to the 7th. This is not the case.
- Changes in the scoring categories must be reflected in changes in the methodology, and there is no obvious way to retrieve the methodology from any other than the current year. (For example, weights for category scoring are visible in the 2023 edition, but the categories have changed since then, and there does not appear to be a public update to the weighting system.)
- The detailed results for the 2024 and 2025 Scorecards are not retrievable, as the pages from 2024 forward are rendered using JavaScript.
| Scorecard Categories over time | |||||||
|---|---|---|---|---|---|---|---|
| ⬇️ Name / Year ▶️ | 2020 (1) | 2021 (2) | 2022 (3) | 2023 (4) | 2024 (5) | 2025 (6) | 2026 (7) |
| Supports Regulation | 1 | — | — | — | n/r | n/r | — |
| Due Diligence | – | 1 | — | — | n/r | n/r | — |
| Transparency & Traceability | 2 | 2 | 1 | 1 | n/r | n/r | 1 |
| Deforestation | 3 | — | — | — | n/r | n/r | 4 |
| Deforestation & Climate | – | 5 | 4 | 4 | n/r | n/r | — |
| Agroforestry | 4 | 6 | 5 | 5 | n/r | n/r | — |
| Living Income | 5 | 3 | 2 | 2 | n/r | n/r | 2 |
| Child Labor | 6 | 4 | 3 | — | n/r | n/r | — |
| Agrichemical Management | — | — | 6 | 6 | n/r | n/r | |
| Child & Forced Labor | — | — | — | 3 | n/r | n/r | 3 |
| Agroforestry & Climage | — | — | — | — | n/r | n/r | 5 |
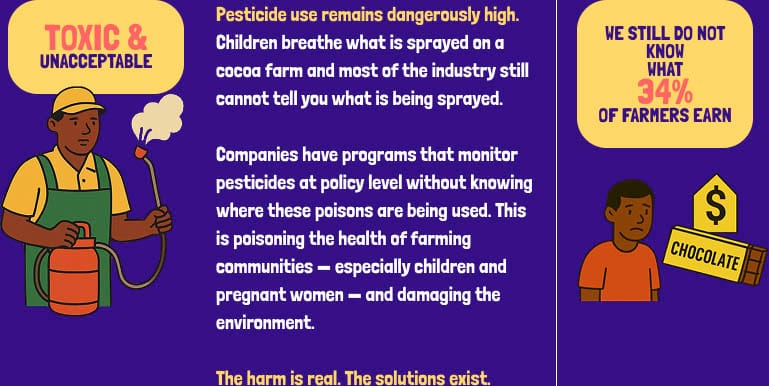
| Pesticides | — | — | — | — | n/r | n/r | 6 |
| Gender | — | — | — | — | n/r | n/r | 7 |
| Farmer Health | — | — | — | — | — | — | n/i |
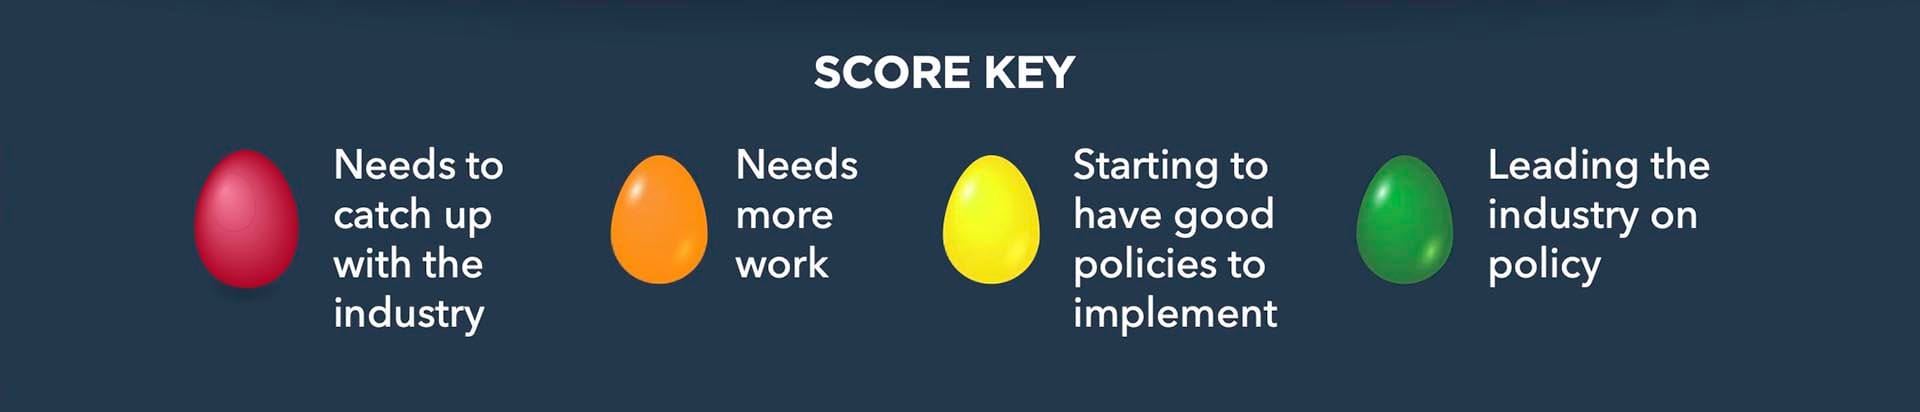
| 2026 Scale | emphases added | |
|---|---|---|
| Green | 100 - 75% | Leading the industry on policy and implementation |
| Yellow | 74 - 50% | Has some good policies and implementation with further progress necessary. |
| Orange | 49 - 25% | Needs significantly more work on policy and implementation. |
| Red | 24 - 0% | Needs to catch up with the industry. |
| Gray | — | Not willing to be assessed; indicates a lack of transparency. |
Question about the scale:
- How were these ranges and the terminology used to describe them determined?
TL;DR Concluding Question
Is it unreasonable to demand that BSF be transparent and traceable in their reporting? What can we reasonably infer from the lack of transparency that is plainly evident in what is reported, and how it is presented?
Does the Chocolate Scorecard – ultimately – serve to greenwash greenwashing?
Other Coverage
There is no publicly accessible archive of the 2025 Scorecard.
There is no publicly accessible archive of the 2024 Scorecard.


Chocolate Scorecard April 2022 snapshot on the Archive.org Wayback Machine.
For completeness. Even Tony’s publicly archives their annual reports.
The Team
What’s missing from the following table?
| Team | Name | Role(s) | Affiliation(s) | URL |
|---|---|---|---|---|
| Executive | Carolyn Kitto | Be Slavery Free | https://www.beslaveryfree.com/ | |
| Executive | Fuzz Kitto | Be Slavery Free | https://www.beslaveryfree.com/ | |
| Executive | Ruben Bergsma | |||
| Executive | Anna Jun | |||
| Advisory | Claire Harris | |||
| Advisory | Cécile Lachaux | |||
| Data Integrity & Ethics and Research | Dr. Puvan Selvanathan | |||
| Data Integrity & Ethics and Research | Dr. Cristiana Bernardi | |||
| Data Integrity & Ethics and Research | Assoc. Prof. Stephanie Perkiss | |||
| Expert Knowledge Scoring | Carolyn Kitto | Gender, Health, Category Alignment, Executive Team | Be Slavery Free | https://www.beslaveryfree.com/ |
| Expert Knowledge Scoring | Fuzz Kitto | Child & Forced Labor, Category Alignment, Executive Team | Be Slavery Free | https://www.beslaveryfree.com/ |
| Expert Knowledge Scoring | Antonie Fountain | Living Income, Category Alignment | ** VOICE Network | https://voicenetwork.cc/ |
| Expert Knowledge Scoring | PAVITHRA Ram | Traceability & Transparency | ** Independent | |
| Expert Knowledge Scoring | Valentin Guye | Traceability & Transparency | ** INRAE | |
| Expert Knowledge Scoring | Friedel Huetz-Adams | Living Income | ** SÜDWIND e.V. (NGO Partner) | |
| Expert Knowledge Scoring | Amourlaye Touré | Child & Forced Labor | ||
| Expert Knowledge Scoring | Sam Mawutor | Deforestation & Climate Change | ||
| Expert Knowledge Scoring | Benjamin Garnier | Deforestation & Climate Change | ||
| Expert Knowledge Scoring | Dr. Eduardo Somarriba | Agroforestry | ** CATIE | https://www.catie.ac.cr/ |
| Expert Knowledge Scoring | Dr. Arlene López Sampson | Agroforestry | ||
| Expert Knowledge Scoring | Rajan Bhopal | Pesticides | ||
| Expert Knowledge Scoring | Raymond Owusu Achiaw | Pesticides | ||
| Expert Knowledge Scoring | Joey Salmon | Pesticides | ||
| Expert Knowledge Scoring | Claire Harris | Retailers | ||
| Expert Knowledge Scoring | Dr. Steve Jennings | Retailers |
There are the same data quality issues (that is, the lack of data) with the NGO and other partners.
Examining the Methodology
The Scorecard methodology formalizes – creating massive institutional inertia – a huge amount of work.
Despite that fact, it is still just an NGO‑designed rating system with substantial self-reported subjectivity baked in. The structure is clear enough for advocacy and company engagement, yet too loose and opaque to treat as a robust, externally verifiable benchmark of “who is sustainable.”
For example, if I were the CEO of a small company who as asked to participate, I could legitimately and respectfully decline, saying, “I don’t agree with your methodology, so we will not take part,” as the reason. That does not indicate a lack of transparency; it signals skepticism of the Scorecard’s process and impact. The current language does not accommodate legitimate reasons a company might give for not participating. The BSF can (and should, IMO) take a neutral stance on non-response, as they did for the 2021 Scorecard.
- Data source: entirely participant company self‑reporting.
There is no independent data collection at the farmer, cooperative, or national system level, and no explicit use of third‑party datasets. - Question design: mixing genuine impact indicators with policy theater.
Because the Insights page then interprets these scores as evidence of substantive leadership or laggard status, you get a tilt toward companies that are fluent in ESG signaling. - Scoring architecture: expert‑driven, but still quite subjective.
• No published scoring rubric; you cannot see, for example, how much more credit a company gets for 80% vs 40% CLMRS coverage, or what exactly differentiates a 6/10 from an 8/10 wildcard answer.
• Wildcard questions are 20% of each category; every major category has a free‑form “showcase” question worth one-fifth of the section score.
• Category weights and aggregation are opaque; it is not clear the relative importance of Child Labor versus Living Income contribute to the overall grade.
• Why the change from “Agrichemical Management” to Pesticides? Are fertilizers no longer an issue? - Category structure: normative choices baked into the framing.
The choice of categories itself embeds a particular theory of change. The architecture centers on what buyer companies can commit to and measure from their desks: certifications, programs, traceability, premiums, and policies. - Retailer vs manufacturer scoring: uneven data expectations.
Retailers are not held to the same granularity of impact data. Instead, they are judged more on whether they demand things from suppliers and on the extent of program coverage. - Farmer Health: important, but quietly sidelined.
Health is treated as important enough to ask about, but not important enough to influence the public grade. It also means there is no public accountability for health claims, since no score is visible and the underlying data are not provided.
- Methodology Pros and Cons Shortlist:
• PRO: Comparing how a participating group of big buyers has improved (or not) in specific operational areas like traceability, CLMRS coverage, and deforestation monitoring.
• PRO: Identifying which companies are engaging and answering questions.
• PRO: Seeing where corporate ESG energy is concentrated: which topics are over‑supplied with policies and pilots, and which are chronically thin.
•• CON: Treating color scores as precise indicators of real‑world impact on forests, incomes, or child labor, especially across years.
•• CON: Inferring anything concrete about non‑participants; the label “not willing to be assessed” is not an empirical finding.
•• CON: Serious econometric or policy analysis without going back to primary sources like NORC, satellite deforestation studies, and national pricing data.
Summary
The methodology is a carefully‑constructed mirror of how the coordinators believe companies should behave and communicate, evaluated through industry experts’ judgment on self‑reported data. It is not a neutral instrument for measuring the cocoa sector as a whole.
Has any independent assessment been done to validate any portion of the methodology, let alone the entire approach?
Examining the Scorecards
This is/was an interactive exploration.
Exploring some Insights
Summary
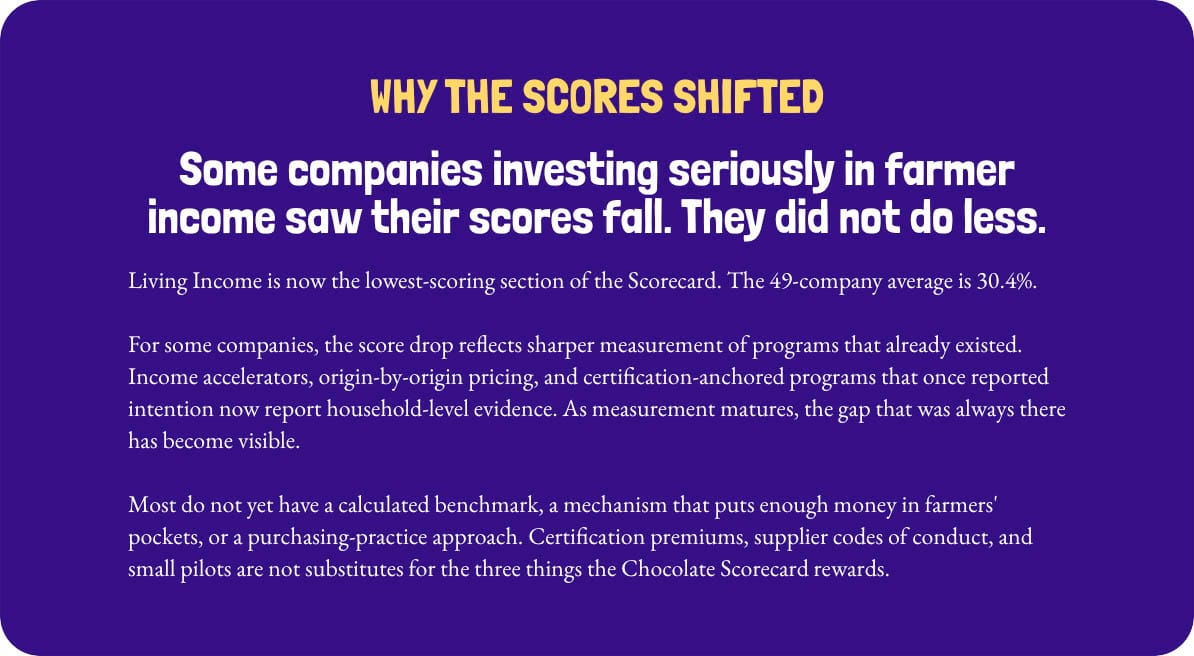
The Insights page does reflect progress on traceability and deforestation‑free sourcing. (However, this is a direct result of the EUDR forcing companies’ hands.) It also underscores, rightly, that living income and child labor remain stubborn failures after decades of promises. At the same time, it:
• Treats non‑participation in the Scorecard as a moral failure rather than a limitation of the Scorecard’s own sample and method.
• Puts most of the responsibility on brands and traders and far less on governments, marketing boards, and macro‑level trade and fiscal structures.
• Blurs the line between “what we can say with high confidence from sector‑wide evidence” and “what our particular scoring system wants to reward.”
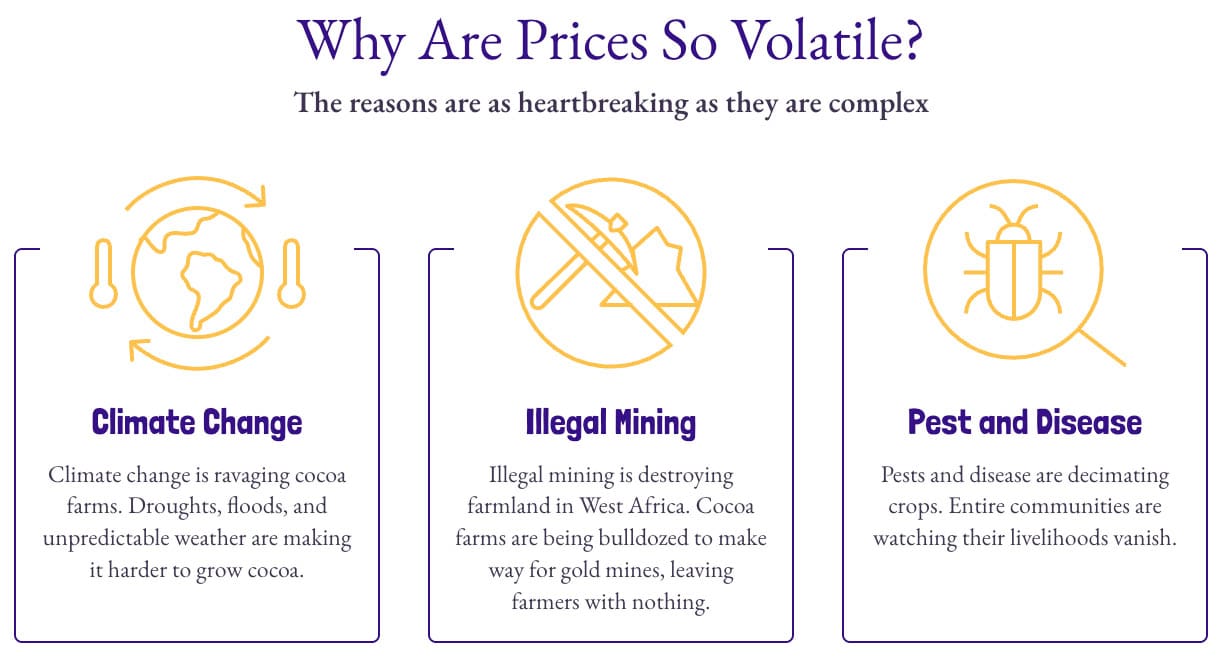
Exploring the State of Cocoa
Calls to Actions
- Be transparent about funding sources [and expenditures].
- Identify and publicly acknowledge even potential conflicts of interest (especially potential funding conflicts of interest) when team members are asked to evaluate companies in the Scorecard.
- Improve transparency by providing links to companies, NGO partners, Team members, and to companies’ public reports related to the Scorecard’s rating and ranking efforts.
- Undergo an assessment of the methodology by independent third party/ies.
- Commission independent market research about the effects the research is having on consumer purchasing behavior.
- Remove the shaming language related to a company deciding not to participate in the Scorecard.
- Publish complete datasets of non-confidential, non-proprietary information for every Scorecard in a form that makes independent longitudinal assessment possible. KIT did this for their Demystifying the Cocoa Sector in Ghana and Côte d’Ivoire study.
TheChocolateLife Report Card for the Chocolate Scorecard
- Transparency and Traceability: Why is there a lack of links to publicly available information about the companies, their published policies and reports, incomplete and incorrect links to NGO partners, non-existent links to Team members, and no reporting around funding?
Grade: F. - Living Income: Pointing out that the problem still exists, and more work needs to be done? Where are policy proposals to hold companies accountable? Grade: F.
- Forced and Child Labor: Pointing out that the problem still exists, and more work needs to be done? Where are policy proposals to hold companies accountable?
Grade: F. - Deforestation/Deforestation and Climate: Performative, much?
Grade: F. - Agroforestry and Climate: The language changes, unexplained, between this and the prior category make longitudinal comparison impossible. Also, performative, much?
Grade: F. - Gender:
Grade: Incomplete - Farmer Health:
Grade: Incomplete
Future Episodes
Episode Hashtags
#cocoa #cacao #cacau
#chocolate #chocolat #craftchocolate
#PodSaveChoc #PSC
#LaVidaCocoa #TheChocolateLife
#PodSaveChocolate and #TheChocolateLifeLIVE Archives
To read an archived post and find the links to watch archived episodes, click on one of the bookmark cards, below.
 Clay Gordon
 Clay Gordon